The Gaze Plot, Opacity and AOIs reports are familiar for those of you who are using eye-tracking.
Having these reports within Feng-GUI Dashboard enhances the analysis possibilities and gives the designer more details about how the viewers perceive what they see.
Feng-GUI Dashboard version 3
Feng-GUI simulates human vision during the first 5 seconds of exposure to visuals. It creates heatmaps based on an algorithm that predicts what a real human would be most likely to look at. This offers designers, advertisers and creatives, a Pre-testing technology that predicts performance of an image, by analyzing levels of attention, brand effectiveness and placement, as well as breaking down the flow of attention.
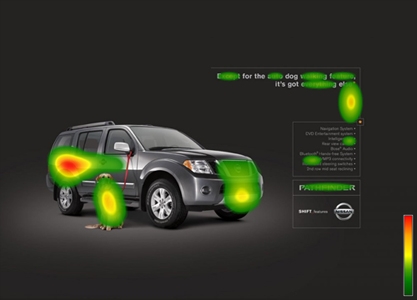
Feng-GUI Attention Heatmap report
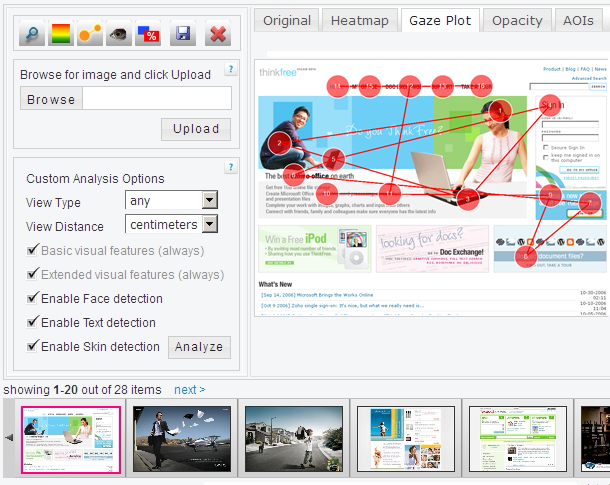
The Gaze Plot report visualizes the scan paths and order between elements inside the image. A Gaze Plot report is also referred as scanpath report.
It is made of a series of short stops (called fixations) and fast movements of an eye (called saccades).
Fixations are marked with circles along with a number that state the order in which the eyes move between fixations.
The first fixation is marked with the number 1. The time between fixations is about 300 milliseconds (ms).
Use the Gaze Plot report to visually demonstrate fixations order and gaze paths.
Feng-GUI Gaze Plot report
The Opacity map report tones down information that is not attractive and visually displays what your viewers may perceive during the first few seconds of visual inspection.
The most transparent areas are those that attract more attention.
Use the Opacity report to identify which areas are being perceived and which are being ignored.
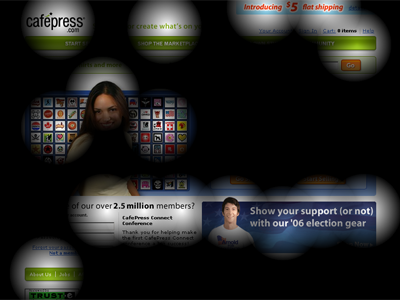
Feng-GUI Opacity Map report
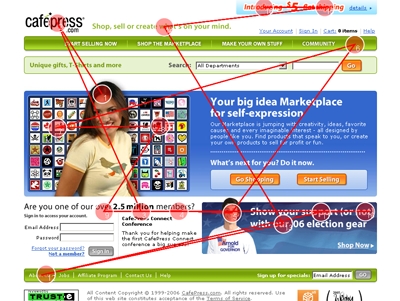
The Areas of Interest report (AOIs) lets you define areas inside the image and determine the percentage of the attention this area is drawing.
Areas of Interest report is also referred as Regions of Interest report (ROIs)
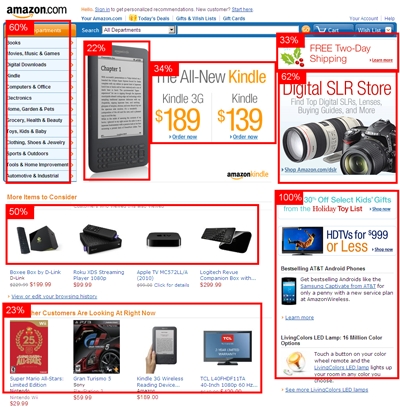
Feng-GUI Areas of Interest AOIs report
Use the Areas of Interest tool to compare results between different versions of your design and layout.

Areas of Interest AOIs tool
The price of usability testing and eye tracking is high and many advertisers, agencies and media companies are not willing to spend that amount of money, per ad or per web page. Designers need to perform a guesswork decisions during the creative process.
Using Feng-GUI attention analysis, designers realize which areas of the webpage, photo or advertisement gets most of the attention.
The reports helps to optimize the layout of a webpage, along with its buttons and banners and identify weak spots within an ad and improve its performance.